Next: Performance Up: Statistical Decision Theory Previous: Neyman-Pearson Formalism
![]()
![]()
![]()
Next: Performance Up: Statistical Decision Theory Previous: Neyman-Pearson Formalism
It is clear that the four probabilities separate into two pairs that must sum to unity, and two pairs are governed by inequalities:
It is also clear that the error rates, P(AR) and P(IA), could be minimized if the two Hamming distance distributions PAu(x) , and PIm(x), had minimal overlap. Their overlap would be reduced if their two means were farther apart, or if their variances were smaller, of both. Of course, the two distributions in general will not be matched in form and variance, as was implied in Figure 7 for simplicity.
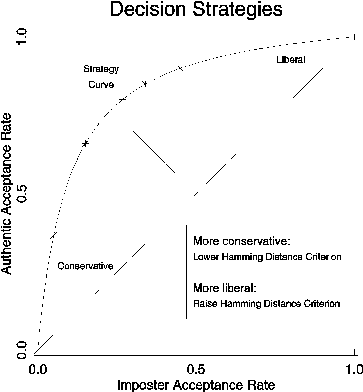
Manipulation of the decision criterion C in (23) - (26), in order to implement different decision strategies appropriate for the costs of either type of error in a given application, is illustrated schematically in Figure 8. Such a decision strategy diagram, sometimes called a Receiver Operating Characteristic or Neyman-Pearson curve, plots P(AA) from (23) against P(IA) from (25) as a locus of points. Each point in such a plot represents a decision strategy as specified by a different choice for the criterion C, as was indicated schematically in Figure 7.

Figure 8: The Neyman-Pearson decision strategy curve.
Inequality (29) states that the Neyman-Pearson strategy curve shown in Figure 8 will always lie above the diagonal line. Clearly, strategies that were excessively conservative or excessively liberal would correspond to sliding along the curve towards the two diagonal extremes. Independent of where the decision criterion is placed along this continuum, the overall power of a pattern recognition method may be gauged by the length of the line segment in Figure 8 joining the diagonal line and the bend in the strategy curve. This distance is monotonically related to the quantity d', for ``detectability" or ``decidability," defined as the difference between the means of the two distributions that were shown schematically in Figure 7 divided by a conjoint measure of their standard deviations. This standard measure of statistical decidability has a value of about d' = 8.4 in the present work.
![]()
![]()
![]()
Next: Performance Up: Statistical Decision Theory Previous: Neyman-Pearson Formalism