Next: Authentics' Hamming Distances Up: Performance Previous: Database
![]()
![]()
![]()
Next: Authentics' Hamming Distances Up: Performance Previous: Database
The distribution of Hamming distances generated by 2,064 direct comparisons between pairwise unrelated iris codes was seen previously in Figure 6. The average Hamming distance was very close to 0.5 since any pair of corresponding bits in the codes for two different irises have equal probability of agreeing or disagreeing. The raw distribution was well described by a suitably fitted binomial model, whose effective number of implicit Bernoulli trials was appropriately reduced to factor out the residual correlations that exist among the bits within a given iris code.

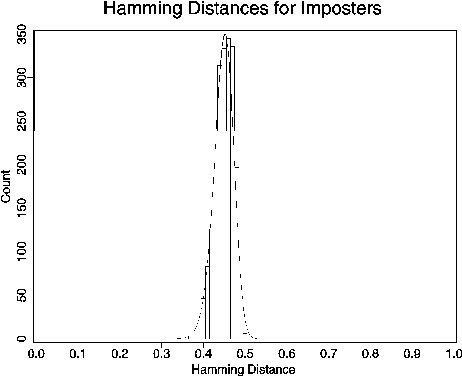
Figure 9: Hamming distances between unrelated iris codes, allowing for n=7 different degrees of eye or head tilt. Solid curve is Eqt. (34).
Because of possible cyclovergence of the eye in its orbit as well as tilting of the head, all iris code comparisons must be performed over a range of relative orientations. The comparison process then becomes a ``best of n" test of agreement, and this must be factored into the statistical decision theory that underlies this method of personal identification. Let fo(x) be the raw density distribution obtained for the Hamming distances between imposters after testing only at a single relative orientation; for example fo(x), might be the binomial defined in (22). Then Fo(x), the cumulative of fo(x) from 0 to x, becomes the probability of making a False Accept in such a test when using Hamming distance criterion x:
or, equivalently,
Clearly, then, the probability of not making a False Accept when using criterion x is 1-Fo(x) after a single test, and it is [1-Fo(x)]n after carrying out n such tests independently at n different relative orientations. It follows that the probability of a False Accept after a ``best of n" test of agreement, when using criterion x, is
and the expected density fn(x)associated with this cumulative is
Figure 9 shows the distribution of Hamming distances obtained from 2,064 pairwise comparisons among the same set of unrelated iris codes as was used in Figure 6, but allowing for n=7 different relative orientations of the eye. The distribution is biased toward a lower mean Hamming distance of , since only the best level of agreement after all 7 rotations (i.e. the smallest Hamming distance) is kept and registered as the degree of match. The solid curve in Figure 9 is a plot of (34), using as its term fo(x) the binomial density distribution specified earlier in (22) and plotted in Figure 6, and using the cumulative of this as its Fo(x) term.
![]()
![]()
![]()
Next: Authentics' Hamming Distances Up: Performance Previous: Database