Next: Decision Confidence Levels Up: Performance Previous: Authentics' Hamming Distances
![]()
![]()
![]()
Next: Decision Confidence Levels Up: Performance Previous: Authentics' Hamming Distances
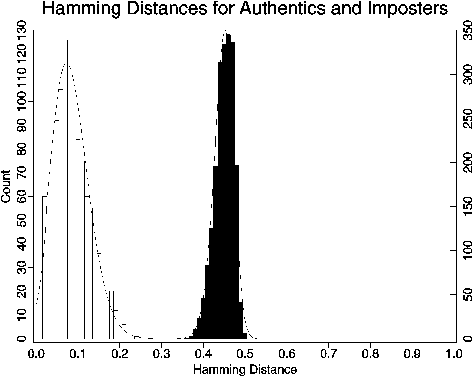
The distributions of Hamming distances for 2,064 pairwise comparisons of ``imposters" (summed across pairwise unrelated iris codes), and for 1,208 pairwise comparisons of ``authentics" accumulated separately, are shown together for comparison in Figure 11. They are clearly well separated, with no empirical overlap and with no observations whatever falling in the region of 0.25 to 0.35 Hamming distance. These superimposed density distributions should be compared with Figure 7, which represented the classic two-choice decision problem from statistical decision theory.

Figure 11: Hamming distances for authentics and imposters, combined from Figures 9
and 10. Compare this graph with the equivalent from the more recent BT evaluation.
Each bit in an iris code is a random variable, and thus comparisons between iris codes are comparisons between ensembles of random variables. We have seen that on average, when comparing two iris codes obtained at different times from the same (``authentic") iris and making provision for possible head/eye tilt, any pair of corresponding bits have a probability of 0.084 of not matching. Similarly, we have seen that with the same provision any pair of corresponding bits in two iris codes computed from different irises (``imposters"), have a probability of 0.450 of not matching.
Asking whether a given pair of iris codes were generated by the same iris, or by different irises, is then formally equivalent to the task of discovering to which of two possible classes a given coin belongs. For one type of coin the probability of heads is p=0.084, and for the other type it is p=0.450; and the method for finding out which one it is, is to toss the coin many times. Needless to say, sufficiently many tosses could resolve the question about which type of coin it was with enormously high confidence. The shapes of the two distributions shown in Figure 11 would have been expected using about 480 tosses of the p=0.450 coin, and using about 40 tosses of the p=0.084 coin, respectively, in each run of trials.
![]()
![]()
![]()
Next: Decision Confidence Levels Up: Performance Previous: Authentics' Hamming Distances